Development of Multi Sensor Blind Stick ....... ........ by MUHAMMED SHARIF

It Is The Time To .... Develop The Blind Stick To .... a Magic Stick

Development of Multi Sensor Blind Stick ....... ........ ........ by MUHAMMED SHARIF

It Is The Time To .... Develop The Blind Stick To .... a Magic Stick

Development of Multi Sensor Blind Stick ....... ........ ........ ....... by MUHAMMED SHARIF

It Is The Time To .... Develop The Blind Stick To .... a Magic Stick

Development of Multi Sensor Blind Stick ....... ........ ........ ....... ...... by MUHAMMED SHARIF

It Is The Time To .... Develop The Blind Stick To .... a Magic Stick

Sunday 21 April 2013

S'2 WEEK 14 => 15 APRIL - 21 APRIL


I will be working on my FYP report, it’s going to take time but I will try my best to finish it earlier as Dr.Zulkhairi requested.
After that I need to submit a hard and a soft copy to the library for my FYP report.

later on in shaa Allah i will post a picture of my FYP report.

_____________________________________________________

This is the update for the FYP hardcover 


S'2 WEEK 13 => 8 APRIL - 14 APRIL


This week is about preparing for the finale year project presentation.
And after that present all what I have done to my assessors, ustaz.Kamal and mdm.Zaridah .

S'2 WEEK 12 => 1 APRIL - 7 APRIL


The FYP poster :


S'2 WEEK 11 => 25 MARCH - 31 MARCH


S'2 WEEK 10 => 18 MARCH - 24 MARCH

S'2 WEEK 9 => 11 MARCH - 17 MARCH


VOLTAGE REGULATOR


The voltage regulator module is used to protect PIC and other connected sensors / actuators from over voltage. This is because PIC and all other connected sensors, actuators all support 5V DC only. Over voltage will cause any of the module burn.


 Voltage Regulator


LM7805 is used to regulate voltage in the system and output 5V DC (max output current: 1000mA). It supports input voltage from 7V DC to 18V DC. If the input voltage is over, the LM7805 will burn or auto shutdown due to overheat. The generated 5V from LM7805 will be noise filtered by 0.1uF ceramic capacitor and a 1000uF electrolytic capacitor. This is to avoid high frequency oscillation on the outputs which may cause system hang or unstable.


The voltage regulator module is used to protect PIC and other connected sensors / actuators from over voltage. This is because PIC and all other connected sensors, actuators all support 5V DC only. Over voltage will cause any of the module burn.
LM7805 is used to regulate voltage in the system and output 5V DC (max output current: 1000mA). It supports input voltage from 7V DC to 18V DC. If the input voltage is over, the LM7805 will burn or auto shutdown due to overheat.
The generated 5V from LM7805 will be noise filtered by 0.1uF ceramic capacitor and a 1000uF electrolytic capacitor. This is to avoid high frequency oscillation on the outputs which may cause system hang or unstable.
A diode is connected at the input of the LM7805. This is to avoid voltage connected reversely. An on/off switch is used to turn on/off the system and a LED (5V, 5mA) is used to indicate the system is power on/off. The LED is connected through 1KR resistor to limit current pass through LED is 5mA.


S'2 WEEK 8 => 4 MARCH - 10 MARCH


The H-Bridge

The original concept of the H-Bridge was being able to control the direction a motor was going. Forward or backward. This was achieved by managing current flow through circuit elements called transistors. The formation looks like an H and that's where it gets the name H-Bridge. Here is what it looks like:


The picture above illustrates the 4 base cases that we can get out of the simple version of an H-Bridge. The two cases that interest us are when A & D are both 1 and when B & C are both 1.

When A & D are 1 current from the battery will flow from point A through the motor to D's ground. However for the case when B & C are both 1, current will flow in the opposite direction from B through the motor to C's ground.


The L298 Motor Driver


At below you'll see a sample the H-Bridge with looks like with each pin labeled. 

The advantage that the HN offers is that all the extra diodes typically necessary with a
standard L298 circuit are already internally in the chip. It saves us as designers an extra element for the motor control circuit.


Varying DC Motor Speed


Pins 5 & 7 in the chip pinout above are inputs 1 & 2 respectively. These inputs take what is called a PWM input. The frequency of the PWM is dependant upon the motor. For our motor we'll use a 1 KHz input frequency. This means the motor speed will be updates 1 thousands times a second. The duty cycle of the PWM will determine the speed & direction of the motor.


S'2 WEEK 7 => 25 FEB - 3 MARCH


PWM, or Pulse Width Modulation is a powerful way of controlling analog circuits and systems, using the digital outputs of microprocessors. Defining the term, we can say that PWM is the way we control a digital signal simulating an analog one, by means of altering it's state and frequency of this.

This is how a PWM signal would look like:


The PWM is actually a square wave modulated. This modulation infects on the frequency (clock cycle) and the duty cycle of the signal. Both of those parameters will be explained in details later but by keeping in mind that a PWM signal is characterized from the duty clock and the duty cycle. The amplitude of the signal remains stable during time (except of course from the rising and falling ramps). The clock cycle is measured in Hz and the duty cycle is measured in hundred percent (%).
Clock cycle and Duty cycle parameters
These are the basic parameters that characterizes a PWM signal. The first parameter is the clock cycle. It is the frequency of the signal measured in Hz.
The other parameter has to do with the switching time of the signal. 


All three signals shown above are square wave oscillations modulated as per their oscillation width, so called "duty cycle". They have the same frequency (t1), but they differ on the width of the positive state (t2). The duty cycle is the percentage of the positive state compared to the period of the signal. So:

Period (T) =
        1         
Frequency (F)


A 10% dudy cycle means that the positive stated remains positive for 10% of the period of the signal.

Example:

Suppose that the above signals have a frequency of 1000Hz. This means that their period is 1/1000 =>

T = 0.001 Sec => T = 1mSec

The first signal has 10% duty cycle. This means that during one full period, it remains positive for 10% of the total period:

t2 = 
    10 x T    
100


And this comes to t2 = 0.1mSec. In the first example, the positive state will remain for 0.1 mSec.
With the same way we can calculate the t2 (positive state) of the other two signals:


Signal 2, 40%:

t2 = 40 x 1mSec / 100 = 0.4 mSec

Signal 3, 90%:

t2 = 90 x 1mSec / 100 = 0.9 mSec 


Pulse-Width-Modulation (PWM) in Microcontroller
The Pulse-Width-Modulation (PWM) in microcontroller is used to control duty cycle of DC motor drive. PWM is an entirely different approach to controlling the speed of a DC motor. Power is supplied to the motor in square wave of constant voltage but varying pulse-width or duty cycle. Duty cycle refers to the percentage of one cycle during which duty cycle of a continuous train of pulses. Since the frequency is held constant while the on-off time is varied, the duty cycle of PWM is determined by the pulse width. Thus the power increases duty cycle in PWM.
The expression of duty cycle is determined by,

%Dutycylcle=ton/T x 100%

Basically, the speed of a DC motor is a function of the input power and drive characteristics. While the area under an input pulse width train is measure of the average power available from such an input.

S'2 WEEK 6 => 18 FEB - 24 FEB


Direct current (DC) motor has already become an important drive configuration for many applications across a wide range of powers and speeds. The ease of control and excellent performance of the DC motors will ensure that the number of applications using them will continue grow for the foreseeable future. This project is mainly concerned on DC motor speed control system by using microcontroller PIC 16F877A. Pulse Width Modulation (PWM) technique is used where its signal is generated in microcontroller. The PWM signal will send to motor driver to vary the voltage supply to motor to change the speed when the distance changes.


Direct current (DC) motors have variable characteristics and are used extensively in variable-speed drives. DC motor can provide a high starting torque and it is also possible to obtain speed control over wide range. We need a speed motor controller in the most of the robots. For example, if we have a DC motor in a robot, if we just apply a constant power to each motor on a robot, then the robot will never be able to maintain a steady speed. It will go slower over carpet, faster over smooth flooring, slower up hill, faster downhill, etc. So, it is important to make a controller to control the speed of DC motor in desired speed.
DC motor plays a significant role in modern industrial. These are several types of applications where the load on the DC motor varies over a speed range. These applications may demand high-speed control accuracy and good dynamic responses.
In home appliances, washers, dryers and compressors are good examples. In automotive, fuel pump control, electronic steering control, engine control and electric vehicle control are good examples of these. In aerospace, there are a number of applications, like centrifuges, pumps, robotic arm controls, gyroscope controls and so on.


 Most DC motors are normally very easy to reverse, simply changing the polarity of the DC input will reverse the direction of the drive shaft. This changeover process can be achieved via a simple changeover switch or for remote or electronic control, via a suitable relay. When using a switch or relay always check the contact current ratings and allow for larger currents to be switched, as different mechanical loads and instant reverse can draw much higher currents than when the motor is being run unloaded.
Another big advantage of DC motors is that variable speed control is easy and can be achieved with just a suitable variable resistor / rheostat or variable DC power supply. For more precise control and maximum efficiency there are many other electronic PWM (pulse width modulation) solutions, although these tend to have added complexity. Most DC motors are designed to exhibit the same speed and output torque in either the forward or reverse direction. Drive shaft speeds rpm (Revs Per Minute) are quoted with motor unloaded. The specifications considered for DC geared motor SPG30-300K are stated below:
  • ·         DC12V
  • ·         Output Power: 1.1 Watt
  • ·         Rated Speed: 12RPM
  • ·         Rated Current: 410mA
  • ·         Rated Torque: 1176mN.m


 DC geared motor SPG30-300K


DC motor Speed Controller

For precise speed control of system, closed-loop control is normally used. Basically, the block diagram and the flow chart of the speed control are shown below. The speed is compared with the reference speed to generate the error signal and to vary the armature voltage of the motor.


There are several types of DC motors that are available. Their advantages, disadvantages, and other basic information are listed below

Type
Advantages
disadvantages
Stepper motor
Very precise speed and position control. High Torque at low speed.
Expensive and hard to find. Require a switching control circuit
Dc motor w/field coil
Wide range of speeds and torques. More powerful than permanent magnet motors
Require more current than permanent magnet motors, since field coil must be energized. Generally heavier than permanent magnet motors. More difficult to obtain.
DC permanent magnet motor
Small, compact, and easy to find. Very inexpensive
Generally small. Cannot vary magnetic field strength
Gasoline (small two stroke)
Very high power/weight ratio. Provide Extremely high torque. No batteries required.
Expensive, loud, difficult to mount, very high vibration.


Sunday 17 February 2013

S'2 WEEK 5 => 11 FEB - 17 FEB


ADC (Analog to Digital Converter)


Block Diagram of Partial Discharge In Data Storage


Data from the sensor will flow to analogue-digital converter (ADC). In this part, the data will convert from analogue to digital. It will separate regarding the level of the voltage or the waveform itself. If sampling rate at the waveform are low the bit after ADC is also low and sampling rate are high the bit on ADC will be high. The quality of the waveform will be determined by the variable. The ADC has to work depending on the frequency of the sensor and the voltage to make it more accurate or same as original waveform and simple to construct the circuit in the ADC with 8 bit resolution.
The data from the ADC will go to storage, but in storage there will be another circuit and program that have been done to ensure that the data will store in the storage. The circuit is to control the data to go to specified program to save in some format file and store it in the storage. The specified program is to manage the data not be separate in any ways but it have to be structured according right sequential. This will ensure that the data can be saved in one format and not to be interrupted by the other files in the storage.


Internal Error in Analogue to Digital Converter

In process converting analogue to digital output, a quantization error is inherent in all analogue to digital converter while sampling in amplitude axis. For example a four bit ADC which is has resolution of (1 cont/100mV) shows results for the different range for the output, for 1 count its between minus 0.5 to plus
0.5 in the range of the input. To more understanding, the figure below is illustrated;


The quantization error at amplitude


The figure show an example that all analogue voltage values from 50mV to 150mV is produce same digital output, 0001; and between 150mV to 250 is 0010. Thus it will count as one value in digital. However, in analogue input is between from 250mV to 350mV and the value in digital is 0011, converting the value again into analogue the value is shown as 300mV but the actual value is not 300mV cause the original value is between 250mV to 350mV. Thus in this case the quantization error for this digital value is ±50mV. So the internal problem in making the analogue to digital converter circuit its can only be minimize.


Analogue to digital converter in PIC

PIC is a family of Harvard architecture microcontrollers made by Microchip Technology, derived from the PIC1640 originally developed by General Instrument's Microelectronics Division. The name PIC initially referred to "Peripheral Interface Controller”. PICs are popular with both industrial developers and hobbyists alike due to their low cost, wide availability, large user base, extensive collection of application notes, availability of low cost or free development tools, and serial programming (and re-programming with flash memory) capability. PIC16F877A is a small piece of semiconductor integrated circuits. The package type of these integrated circuits is DIP (Dual Inline Package) package. This package is very easy to be soldered onto the strip board. However using a DIP socket is much easier so that this chip can be plugged and removed from the development board. The purpose of using PIC 16F877A is writes a program into it. It is very easy to assemble and it can be programmed and erased up to 10,000 times.


The waveform sampling in discrete time


The figure above show the analogue sample converting to discrete time.
This time sampling is the important part because its will show the quality of converting to digital. If the time sampling is not high so the quality wave form is worse.


Then the discrete-time signal is quantized to generate the digital signal


Sampling in digital signal


After converting to digital, the above figure show the line red is in digital unit of waveform. Digital waveform did not same as the original value because had quantization error. To reduce the quantization error, must put a resolution to make sure that digital output most same as the analogue input.
In PIC16F877A has built in ADC ports, which is port a is a input and port e is output. In PIC, it can be configured according to resolution will need to enhance the quality waveform in 8 bit or 10 bit resolution. The digital signal after conversion represents the digital version of the analogue signals and because it’s have 2 type of resolution, for 10 bit, the accuracy is 1 part in 1024, better than
0.1% at full scale or also 8 bit, the accuracy is 1 part in 256, about 0.5%. There are a few function of ADC ports.
• For 10 bit resolution, the conversion of an analog input signal results in a corresponding 10-bit digital number.
• The A/D module has high and low-voltage reference input that is software selectable to some combination of VDD, VSS, RA2 or RA3.
• The A/D converter has a unique feature of being able to operate while the device is in Sleep mode.
• To operate in Sleep, the A/D clock must be derived from the A/D’s internal RC
oscillator.

S'2 WEEK 4 => 4 FEB - 10 FEB


The HRLV-MaxSonar-EZ sensor line is the most cost-effective solution for applications where precision range-finding, low-voltage operation, space saving and low-cost are needed. This sensor component module allows users of other more costly precision rangefinders to lower the cost of their systems without sacrificing performance.
Additionally, this sensor line allows cost-sensitive designers to choose this precision sensor as a performance upgrade over other lower performance sensors.
The HRLV-MaxSonar-EZ sensor line provides high accuracy and high resolution ultrasonic proximity detection and ranging in air, in a package less than one cubic inch. This sensor line features 1-mm resolution, target-size and operating-voltage compensation for improved accuracy, superior rejection of outside noise sources, internal speed of-sound temperature compensation and optional external speed-of-sound temperature compensation. This ultrasonic sensor detects objects from 1-mm to 5-meters, senses range to objects from 30-cm to 5-meters, with large objects closer than 30-cm typically reported as 30-cm. The interface output formats are pulse width, analog voltage, and serial digital in either RS232 or TTL. Factory calibration is standard.


Precision Ultrasonic Range Sensing


Range-finding at a fraction of the cost of other precision rangefinders.
Reading-to-reading stability of 1-mm at 1-meter is typical.
Accuracy is factory-matched at 1-meter to 0.1% providing a typical large target accuracy of 1% or better for most voltages.
Calibrated acoustic detection zones allows users to choose the part number with the detection zone that, matches their specific application.
Compensation provided for target size variation and operating voltage range.
Internal temperature compensation is standard.
Optional external temperature compensation.

Very Low Power Requirements
Wide, low supply voltage requirements eases battery powered design.
Low current draw reduces current drain for battery operation.
Fast first reading after power-up eases battery requirements.

Easy to use Component Module
Stable and reliable range readings and excellent noise rejection make the sensor easy to use for most users.
Easy to use interface with distance provided in a variety of outputs.
Target size compensation provides greater consistency and accuracy when switching targets.
Sensor automatically handles acoustic noise.
Sensor ignores other acoustic noise sources.
Small and easy to mount.
Calibrated sensor eliminates most sensor to sensor variations.
Very low power ranger, excellent for multiple sensor or battery based systems.


Range Outputs
Pulse width, (1uS/mm).
Analog Voltage, (5mm resolution).
Serial, (RS232 or TTL, where TTL format by solderable jumper or volume orders available as no-cost factory installed jumper).


General Characteristics
Low cost ultrasonic rangefinder.
Sensor dead zone virtually gone.
Size less than 1 cubic inch with easy mounting.
Object proximity detection from 1-mm to 5-meters.
Resolution of 1-mm.
• Distance sensor from 30-cm to 5-meters.
• Excellent To Mean Time Between Failure (MTBF).
• Triggered operation yields a real-time.
• 100mS measurement cycle.
• Free run operation uses a 2Hz filter, with 100mS measurement and output cycle.
• Operating temperature range from -15°C to +65°C, provided proper frost prevention is employed.
• Operating voltage from 2.5V to 5.5V.
• Nominal current draw of 2.5mA at 3.3V, and 3.1mA at 5V.


Applications & Uses
Bin level measurement.
Proximity zone detection.
People detection.
Robots ranging sensor.
Autonomous navigation Distance measuring.
Long range object detection.
Environments with acoustic and electrical noise.
Height monitors.
Auto sizing.


HRLV-MaxSonar®-EZ™ Pin Out


Pin 1- Temperature Sensor Connection: Leave this pin unconnected if an external temperature sensor is not used.

Pin 2- Pulse Width Output: This pin outputs a pulse width representation of the distance with a scale factor of 1uS per mm. Output range is 300uS for 300-mm to 5000uS for 5000-mm. Pulse width output is up to 0.5% less accurate than the serial output.

Pin 3- Analog Voltage Output: On power-up, the voltage on this pin is set to 0V, after which, the voltage on this pin has the voltage corresponding to the latest measured distance. This pin outputs an analog voltage scaled representation of the distance with a scale factor of (Vcc/5120) per 1-mm. The distance is output with a 5-mm resolution. (This output voltage is referenced to GND, Pin 7.) The analog voltage output is typically within ±10-mm of the serial output.
Using a 10bit analog to digital convertor, one can read the analog voltage bits (i.e. 0 to 1024) directly and just multiply the number of bits in the value by 5 to yield the range in mm. For example, 60 bits corresponds to 300-mm (where 60 * 5 = 300), and 1000 bits corresponds to 5000-mm (where 1000 * 5 = 5000-mm).
A 5V power supply yields~0.977 mV per 1 mm. Output voltage range when powered with 5V is 293mV for 300-mm, and 4.885V for 5000-mm.

Pin 4- Ranging Start/Stop: This pin is internally pulled high. If this pin is left unconnected or held high, the sensor will continually measure and output the range data. If held low, the HRLV-MaxSonar-EZ will stop ranging. Bring high for 20uS or longer to command a range reading.

Real-time Range Data: When pin 4 is low and then brought high, the sensor will operate in real time and the first reading output will be the range measured from this first commanded range reading. When the sensor tracks that the RX pin is low after each range reading, and then the RX pin is brought high, unfiltered real time range information can be obtained as quickly as every 100mS.

Filtered Range Data: When pin 4 is left high, the sensor will continue to range every 100mS, but the output will pass through a 2Hz filter, where the sensor will output the range based on recent range information.
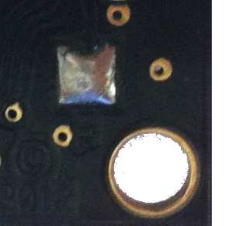
Pin 5-Serial Output: By default, the serial output is RS232 format (0 to Vcc) with a 1-mm resolution. If TTL output is desired, solder the TTL jumper pads on the back side of the PCB as shown in the photo below.


For volume orders, the TTL option is available as no-cost factory installed jumper. The serial output is the most accurate of the range outputs. Serial data sent is 9600 baud, with 8 data bits, no parity, and one stop bit. V+ Pin 6 - Positive Power, Vcc: The sensor operates on voltages from 2.5V - 5.5V DC. For best operation, the sensor requires that the DC power be free from electrical noise. (For installations with bad electrical power, a 100uF capacitor placed at the sensor pins between V+ and GND will typically correct the electrical noise.)

GND Pin 7: Sensor ground pin: DC return, and circuit common ground.


Dead Zone

Ultrasonic sensors have a dead zone in which they cannot accurately detect the target. This is the distance between the sensing face and the minimum sensing range. If the target is too close, the tone bursts leading edge can travel to the target and strike it before the trailing edge has left the transducer. Echo information returning to the sensor is ignored, because the transducer is still transmitting and not yet receiving. The echo generated could also reflect off the face of the sensor and again travel out to the target. These multiple echoes can cause errors when the target is in the dead zone.


Beam Angle

The beam cone angle values are the 3 dB points (i.e., points at which the sensor signal is attenuated by at least 3 dB). Outside this cone angle, the ultrasonic signal exists, but is rather weak. Targets may still be detected. This can be experimentally determined.


Beam Cone Diameter

The ultrasonic sensor emits ultrasound wave in a beam angle cone that eliminates side lobes. Target size versus beam spot size is important. Theoretically, the smallest detectable target is one half the wavelength of the ultrasonic signal.
Ultrasonic transducer is embedded, watertight, into the sensor housing, in polyurethane foam. The transducer transmits a packet of sonic pulses and converts the echo pulse into voltage. The integrated controller computes the distance from the echo time and the velocity of sound. The transmitted pulse duration and the decay time of the sonic transducer result in a blind zone in which the ultrasonic sensor cannot detect an object. Normally, the ultrasonic frequencies are between 65 kHz and 400 kHz, depending on the sensor type and the pulse repetition frequency is between 14 and 140 Hz.